|
IntrepidTrader marked a recent market top and bottom in the
major indexes. Here is an example using the QQQQ which was
well documented in our IntrepidTrader Newsletter that was sent
for the weeks of October 27th, November 3rd
and November 10th.
From the October 27th
Newsletter:
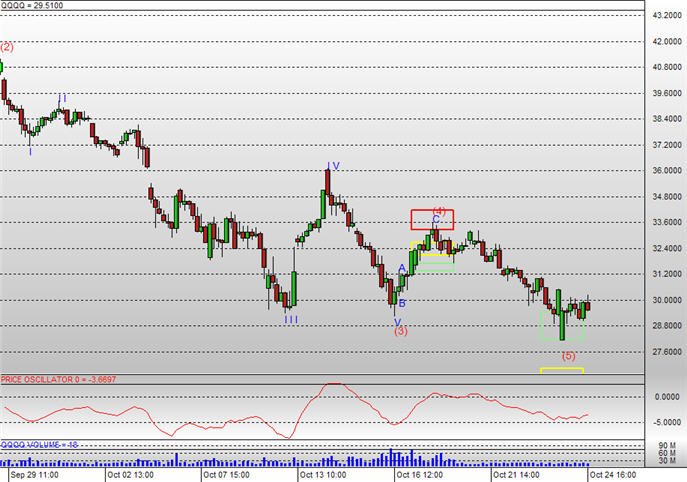
QQQQ 60 Minute
After wave four terminated at
the red Fibonacci target for this wave, the market declined
beneath the end of wave three to create wave five. Currently,
we can see that wave five has reached the green Fibonacci
target box for this wave. Traders may want to watch for a
correction greater than wave four in the chart above as a
possible indication that this wave count could be over.
The green box in the bottom
right of the chart was created by IntrepidTrader. It marks a
projected end of this move. Once the market reached this
target, it rallied to create a bullish correction as can be
seen below.
From the November 3rd
IntrepidTrader Newsletter:

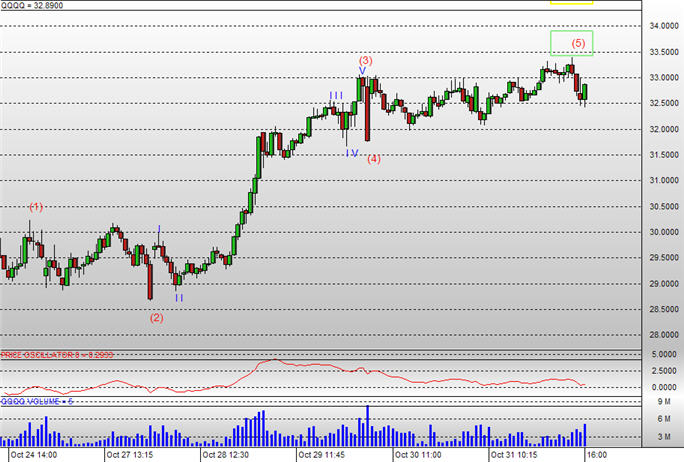
QQQQ 60 Minute
You
may recall from last week's newsletter that IntrepidTrader has
identified the current wave as wave five on the 60 minute time
interval for the QQQQ. You may also recall that the market had
reached the green Fibonacci target box for this wave. During
last week's trading, we can see that the market rallied from
this low and made a correction greater than wave four within
this five wave sequence. The point at which the market needed
to rally in order to make this correction is marked by the
blue line at 32.52.
Then,
we moved to a lower time frame to see the wave count that was
created after the correction was made.
From
the same November 3rd Newsletter:
QQQQ 15 Minute
As
we move down to the 15 minute time interval for the QQQQ, we
can see that the market has created an identifiable five wave
sequence. We can also see that IntrepidTrader has projected
the Fibonacci targets for wave five and that the market has
traded just below the green Fibonacci targets for this wave.
Finally, the market rallied
into the green Fibonacci target box shown above.
From
the November 10th IntrepidTrader Newsletter:

QQQQ 30 Minute
As
a follow-up to last week's newsletter, I would like to briefly
look at the QQQQ 30 minute chart.
If you recall, I ended the
analysis of the QQQQ with a 15 minute chart which corresponds
to the chart above. In that analysis, I mentioned that the
first objective for a wave count would be the green Fibonacci
target box for wave five. I also mentioned that if the market
made a correction greater than wave four that this wave count
could be over.
During last week's trading, we
can see that the market advanced to the green Fibonacci target
box. After it reached this price level, the market then made a
correction greater than wave four within the five wave
sequence. The key things that traders may want to observe here
is the forward-looking analysis that can be done with the
Fibonacci targets and the confirmation that follows as we
require the market to correct by a specific amount. These are
the types of quantitative rules which can be incorporated into
a defined trading methodology.
Summary
Just to recap the information
above:
-
In the
October 27th newsletter, IntrepidTrader projected
the end of a bearish decline on the QQQQ 60 minute chart.
-
In the
November 3rd newsletter, the bearish decline was
confirmed and another opportunity was identified on the QQQQ
15 minute chart as the market rallied.
-
Then, the
market reached the Fibonacci target box for the rally shown
on the 15 minute chart as shown in the November 10th
newsletter.
It's
important to be prepared for moves like this, is it not? Our
clients were prepared for these moves well in advance. And, as
you realize the trading edge gained by using IntrepidTrader,
it probably causes you to see how you could use it to become a
successful trader. Think of how confident you'll feel when you
use IntrepidTrader to find opportunities like these for
yourself. Click the link below to find out how to get your
copy and get started today!
Click Here For More Details! |