Figure
5
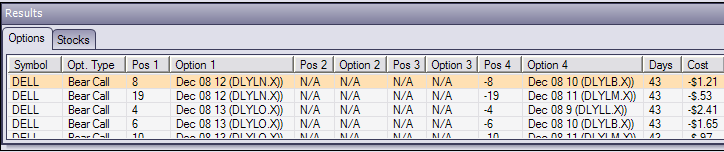
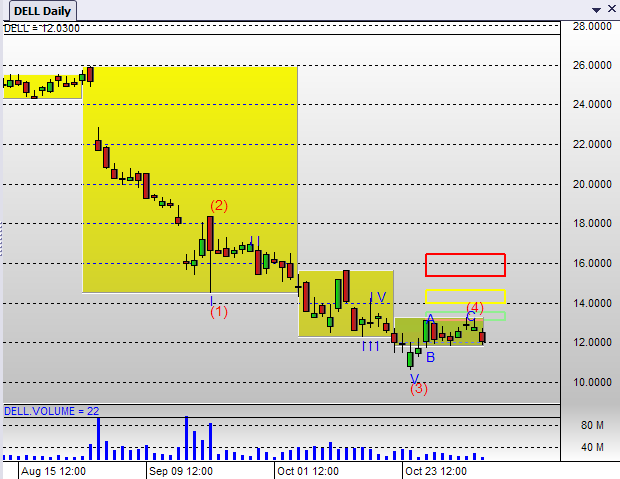
Those interested in option trading may also want to look at the chart related to this option spread to time our entry. In Figure
5, we can see a price chart for the security that relates to the option spread that we were just looking at. As you can see, the price target projected by IntrepidTrader catches the end of this Elliott Wave four correction. At this point, we want to use the gold boxes drawn around recent price action to enter this market. So, as prices break out of the box
to the down side, we may want to enter our option spread shown in Figure
4. Also, we may want to exit our position if the market
moves above the top of the box. Naturally, this example
allows you to easily see the advantages you would have over
others by combining Elliott Wave and option trading
analysis.
IntrepidTrader combines the precision of Elliott Wave
analysis with the powerful leverage found in option trading.
And as you can see, it even helps you determine your risk /
reward and probability of profit of the option spread before
the trade is entered. Realizing that all of this analysis
was done by clicking one button may cause you to understand that powerful and effective trading tools can save you time and boost your profits. And as you imagine what this could be like for you, you may find yourself wanting to see IntrepidTrader in action. |